
DPI Climate R&D Hub
Toolkits
Free, open maps and dashboards from our research for exploring heat, air quality, floods and nature in Chicago, the Quad Cities and across Illinois.
Urban Scalable Toolkit for Infrastructure Resilient Regions
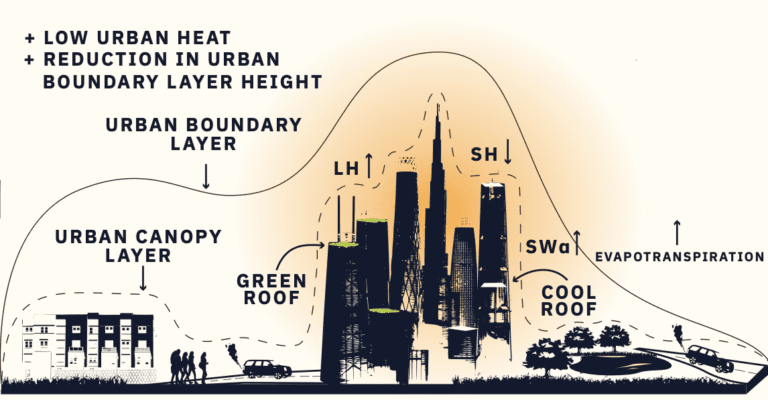
Explore satellite data and high-resolution climate model results on heat and air quality across the Chicago metropolitan area.
Open the toolkit →About this tool
This NASA project offers a web-based visualization toolkit for exploring Earth science data and high-resolution climate model output, to share information and support decisions about air quality and heat in the Chicago metropolitan area. Users can also explore related environmental and social data to identify extreme heat and air quality threats to health and equity, and to improve urban decision-making.
Funded by NASA award 80NSSC20K1342.
Mapping flood reductions with nature-based solutions in the Quad Cities (opens in a new tab)
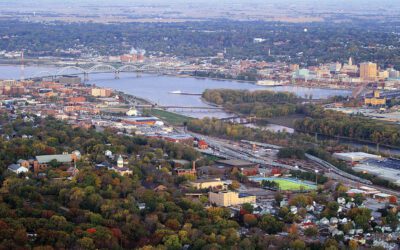
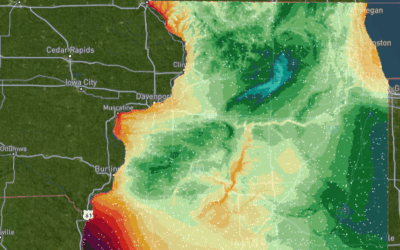
See which parts of the Quad Cities are most exposed to flooding, and how much nature-based solutions could help.
Open the map → (opens in a new tab)About this tool
Heavier rainfall and spreading floodwaters, driven by climate change, affect residents. Our detailed analysis of the Quad Cities identifies the areas most vulnerable to floods and shows how nature-based solutions (NbS) can protect them.
Related: Navigating Climate Challenges in the Quad Cities (full report, PDF, 4.9 MB) · papers in Hydrological Sciences Journal and Frontiers of Earth Science
Flood Risks on Fuel Stations for the State of Illinois (opens in a new tab)
Pick a possible fueling-station location anywhere in Illinois and see its flood risk right away.
Open the dashboard → (opens in a new tab)About this tool
As the Federal Highway Administration plans where to place fueling stations amid rising seas and heavier rainfall, this interactive dashboard lets users pinpoint possible locations and instantly assess their flood risk, for smarter, safer and more resilient infrastructure. Part of AerisIQ.
Flood Tracker (opens in a new tab)
Water in your basement? A flooded street? Share what you see, and see what your neighbors have reported.
Report or view floods → (opens in a new tab)About this tool
Share information about flooding near you on this easy-to-use website. Reports collected in Flood Tracker help show how flooding affects neighborhoods, and help communities find better ways to warn, respond and invest in becoming resilient to flood hazards. Part of AerisIQ.
HiTAB: Height of Trees and Buildings for Chicago (opens in a new tab)
The height of every tree and building in Chicago at 1-meter resolution, ready for urban climate models.
Open the map → (opens in a new tab)About this tool
We mapped the height of trees and buildings (HiTAB) across Chicago at 1 m resolution by combining high-precision LiDAR point clouds, building footprints and multi-band satellite images. Because the maps are so detailed, physics-based and data-driven urban models can use them to reach higher resolution and accuracy with less uncertainty.
Related: the paper in Environmental Research Letters · our news post
Ecological Corridor Network: Connecting Nature Across the Quad Cities (opens in a new tab)
A map of connected forests, wetlands, parks and open spaces to guide conservation for flood control and biodiversity.
Open the story map → (opens in a new tab)About this tool
The Ecological Corridor Network is a system of connected natural spaces, bringing together forests, wetlands, parks and open spaces across the region. By showing the key links between existing and possible parks, preserves and other green spaces, the map serves as a blueprint for coordinated conservation. It helps conservation practitioners in the Quad Cities direct effort and funding to the places with the greatest need and impact for flood mitigation and biodiversity.


Want to use one of these tools in your community, or have data to share? Contact the Climate R&D Hub.